Australian agricultural exports to the ASEAN region are increasing. This has been driven by strong economic growth, burgeoning food and fibre processing sectors, and efforts to diversity Australian agricultural exports.
Record level of Australian agricultural exports to ASEAN
- In 2022-23, a record 23% of Australian agriculture, fisheries and forestry (AFF) exports went to the ASEAN region (Figure 1), worth A$19b. In return, ASEAN members supplied 19% of Australia’s total AFF imports, and were our second largest supplier in 2022-23 after the EU.
- The ASEAN region includes some of the fastest growing economies in the world. Growth in real gross domestic product (GDP) is forecast to be 4.8% for ASEAN members in 2024, compared to 2.7% globally.
- The total value of ASEAN AFF imports from the world has grown from US$120b in 2018 to US$168b in 2022 (Figure 2).
Figure 2: ASEAN agricultural, fisheries, and forestry imports from the world
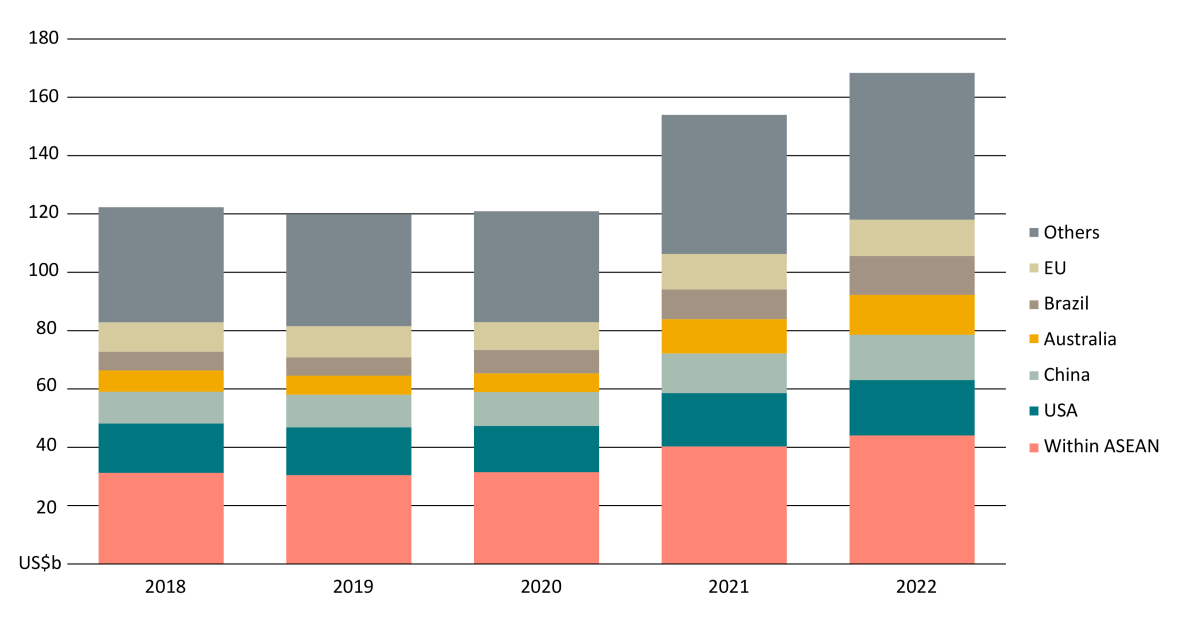
Source: UN Comtrade 2023. Note: Laos’ import data for 2022 is not available and is missing from the 2022 total in Figure 2.
Figure 1: Australian agricultural, fisheries, and forestry exports
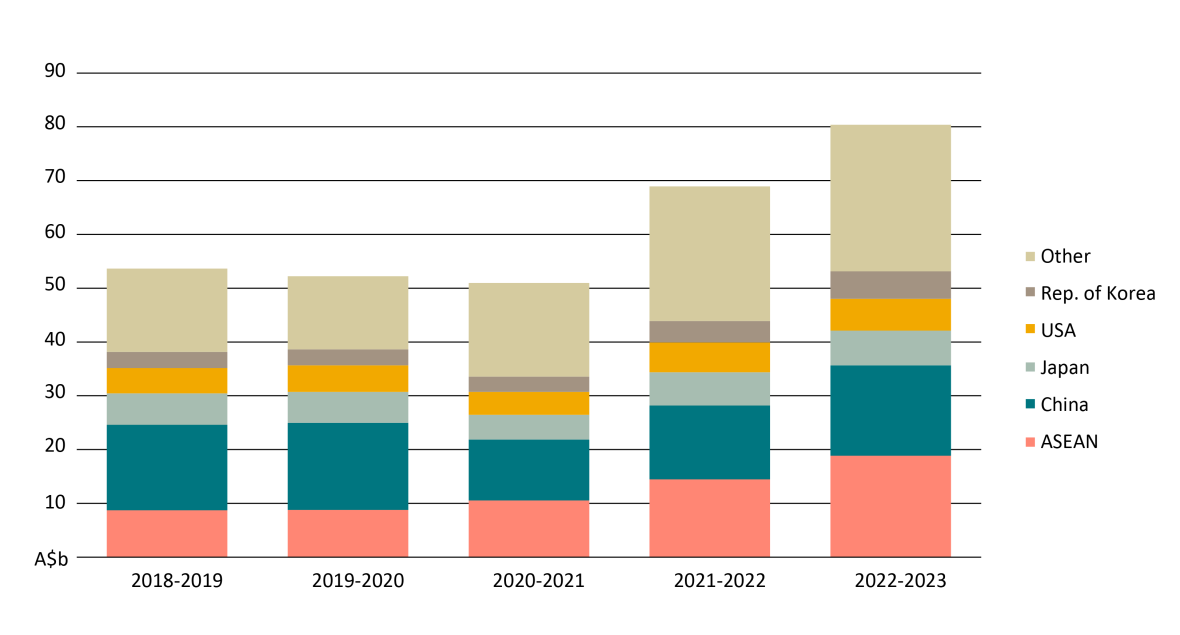
Source: ABS 2023. Confidentialised country data has been excluded.
Major drivers of ASEAN agricultural imports
- Rising incomes are contributing to a growth of urbanised and affluent middle class across ASEAN, leading to shifts in consumer preferences and increasing demand for high-quality, high-value and differentiated agricultural produce such as meat, seafood, and wine.
- ASEAN’s food and fibre processing industries are growing, increasing demand for inputs, such as wheat and cotton. Australia provides raw materials to support ASEAN’s processing industries and imports processed commodities such as baked goods and pasta noodles (A$299m and A$202m respectively in 2022-23).
- ASEAN demand for Australian AFF goods should continue growing to 2040, with Australia’s complementary agriculture seasons and climates, production capabilities, expertise, and geographic proximity making it an ideal partner for Southeast Asia.
Figure 3: Selected Australian AFF exports, difference over five years.
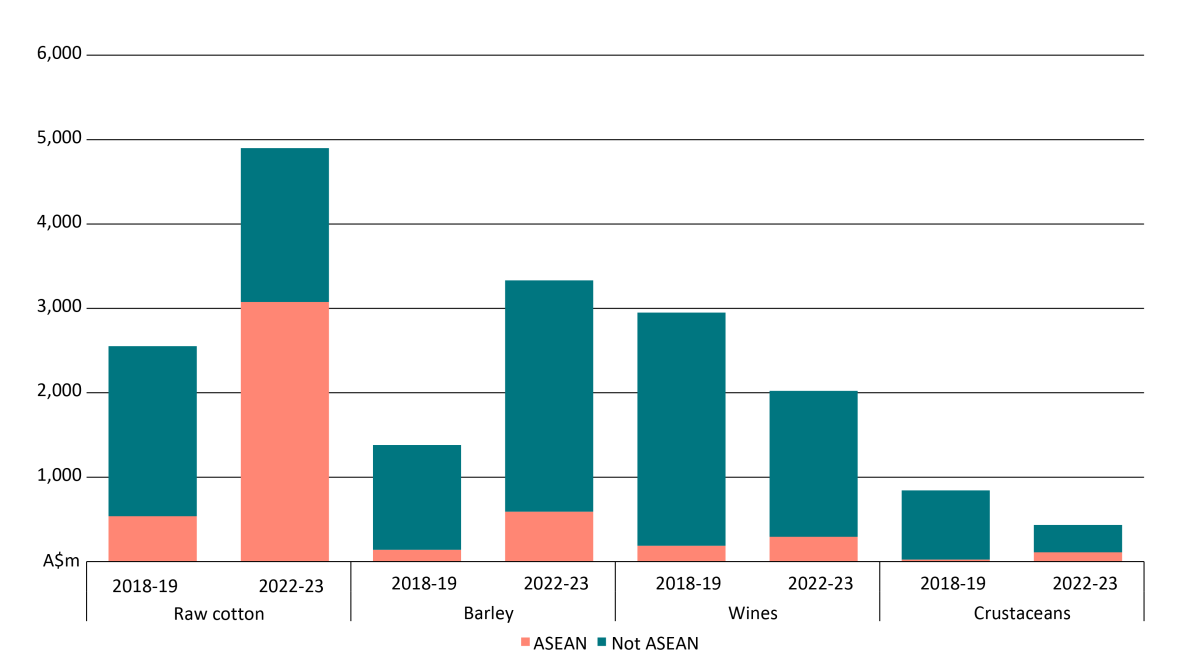
Source: ABS 2023. Confidentialised country data has been excluded
A cotton processing hub supporting Australian exporters
- ASEAN countries are an increasingly important part of the global fibre processing supply chain.
- In Vietnam, spinning mills import raw cotton and transform it into cotton yarn. The yarn is used in the Vietnamese textile and apparel industry or re-exported abroad, mainly to China and South Korea.
- Since 2018-19, exports of cotton grew+473% to reach A$3.1b in 2022-23. Growth was particularly strong into Indonesia and Vietnam to support their growing textile industries.
Barley for food, drinks, and animal feed
- Since 2018-19, exports of Australian barley to ASEAN grew +324% to reach A$590.8m.
- Growth was especially strong to Vietnam, for use in food processing, beer production, and as animal feed.
- Demand for alcohol and meat will continue to rise in the region, creating more opportunities for malting barley and animal feed.
Imported seafood and wine on the menu
- Since 2018-19, exports of crustaceans to ASEAN grew +358% to reach A$110.4m in 2022-23, and salmon exports increased 278% to reach A$87m. The largest markets for crustaceans and salmon were Vietnam and Indonesia, respectively. Seafood exports have been driven by increased salmon production in Australia and diversification of rock lobster exports.
- Since 2018-19, exports of Australian wine to ASEAN grew by +57% to reach A$294.2m in 2022-23. Wine exports have especially increased into Thailand, driven by Thailand’s large tourism industry and growing interest in wine as a premium good.